
Hugo Brandão ¹*, Guilherme Pinto² and Tatiana Santos³
-
- Pimenta de Ávila Consultoria, Minas Gerais – Brazil, Geotechnical Engineer, hugo.assis@pimentadeavila.com.br, +55 31 99912-1993
- Pimenta de Ávila Consultoria, Minas Gerais – Brazil, Geotechnical Engineer, guilherme.henrique@pimentadeavila.com.br, +55 31 99680-2136
- Postgraduation Program of Mineral Engineering, Universidade Federal de Ouro Preto, Minas Gerais – Brazil, Doctor Professor, tatiana.santos@ufop.edu.br, +55 31 3559-1735
ABSTRACT
Undrained shear strength of tailings is one of the most important parameters used to evaluate tailing’s dam stability conditions. Several methodologies (empirical and analytical) have been developed to evaluate the yield undrained shear strength based on piezocone penetration data (CPTu) using bearing capacity factor theory (Nkt). However, most of these methodologies or correlations consider assumptions proposed to natural soils and they can result in inconsistent values if directly applied to manufactured material such as bauxite tailing. Researchers have recently applied data science techniques in order to obtain more robust and accurate models, reducing empiricism and increasing the reliability of the results by developing models capable of predicting the undrained strength. In this article, K-Nearest Neighbors (KNN) method was applied to evaluate the yield undrained shear strength of a bauxite tailings based on CPTu data (independent variables) and field vane shear test (dependent variable). KNN method is a machine learning technique capable of classify or predict a value based on the distance of nearest values from the unknown data and it does not require assumptions to learn from previous cases/instances. To apply KNN method, a dataset was constructed by eleven pairs of CPTu and field vane shear test from a specifical site. The results obtained by KNN method were compared with the conventional approach by using the Nkt, Nke and NΔu values that results in the lowest error metrics. The results of this study clearly demonstrated that the KNN model can be applied to evaluate the undrained shear strength of the bauxite tailings.
*Corresponding author: Pimenta de Ávila Consultoria, Geotechnical Engineer, Alameda Oscar Niemeyer, 420 – Vale do Sereno, Nova Lima, Minas Gerais – Brazil, CEP: 34000-000. Phone: +55 31 99912-1993. Email: hugo.assis@pimentadeavila.com.br
INTRODUCTION
The correct determination of the strength parameters of tailings is highly important in the context of geotechnical engineering since they are crucial for evaluating the stability condition of a geotechnical structures. If this parameter is wrongly determined, there will be a risk of inaccurate design of geotechnical structures and it could not present enough resilience against the expected load that the structure will face throughout its life cycle, leading to its failure. Besides, the importance of the physical and chemical characterization of the tailings is highlighted in the Global Industry Standard on Tailings Management – GISTM (GISTM, 2020).
The yield undrained shear strength (Su) is defined as soil/tailing strength in a saturated or nearly saturated condition, which is mobilized under a fast loading without allowing time for the soil to change its volume, dissipating the excess of the pore water pressure generated (Lunne et al., 1997). To evaluate the Su is common to perform field investigations, such as Cone Penetration Test with Porepressure measurement (CPTu) and Vane Shear Test (VST).
The VST is the equipment used to determine Su values in saturated clay deposits, by the rotation of a set of cruciform rectangular blades pushed to pre-defined depths with velocity equal to 6±0.6°/min as described by ASTM D2573-08 standard (ASTM, 2015). The CPTu test consists of a 60° cone penetrometer pushing equipment, with a cross-sectional area of 10 cm2 and a 150 cm2 friction sleeve (commonly), and a data acquisition system. The cone penetration test is usually carried out with a speed of 2.0±0.5cm/s, with readings being recorded every 1cm to 5cm, as described by ASTM D-5778 standard (ASTM, 2020). The CPTu provides three independent measurements: i) the cone tip resistance (qc), which characterizes the soil/tailings strength to cone penetration, ii) the sleeve friction (fs), which represents the soil/tailings adhesion to friction sleeve and iii) the porewater pressure, commonly measured behind the cone tip (u2). Also, it is common to perform dissipation test to evaluate the equilibrium porepressure (u0), which consist in the fully stop of the cone penetration and the measurement of porewater pressure dissipation.
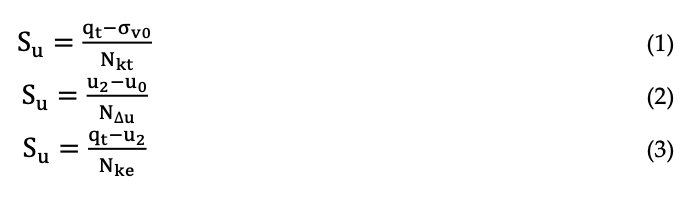
To obtain the Su values from the CPTu test, there are three independent equations based on the bearing capacity factor theory, by using Nkt, Nke and NΔu values, as described by Equations 1 to 3 (Lunne et al., 1997). Commonly, these parameters are obtained through specific empirical correlations, considering each studied site.
To avoid the empiricism of the bearing capacity factors correlation, data science techniques have been successfully applied, as presented by many authors, such as Zhang et al. (2021), Ly & Pham (2020), Abu-Farsakh & Mojumder (2020) and others. These techniques are based on algorithms that use mathematical, statistical, and/or computational knowledge, to detect database patterns and perform supervised and unsupervised training, allowing to reduce empiricism and development of models that use the knowledge of interrelationships between the variables. The use of these tools can provide greater assertiveness in the determination of the investigated parameters, since the elaborated models reduce the subjectivity attributed to the expert, increasing the reliability of the results obtained and ultimately, producing geotechnical projects safer.
This article has the goal of compare the conventional methodology based on the bearing capacity factor (Equations 1 to 3) with models generated through K-Nearest Neighbors (KNN) algorithm to predict the Su based on the CPTu data (independent variables) and VST (dependent variable). To evaluate the accuracy of these models, it was applied error metrics as described in next item. Also, laboratory tests were performed to characterize the bauxite tailings used in this study. The next topic will show a brief explanation about the KNN method, the error metrics used and the methodology applied.
METHODOLOGY
By use of measurement of eleven pairs of CPTu and VST tests, a dataset was obtained and K-Nearest Neighbors (KNN) model was calibrated in order to predict values of undrained shear strength based on cone tip resistance, the sleeve friction and the penetration porewater pressure. Besides the need to correcting the cone tip resistance to account the effects of the pore water pressure (Lunne et al., 1997), the raw data (qc values) were used as an input of the KNN model in order to not account the effect of the pore water pressure twice in the data set, by using qt (total cone resistance) and u2.
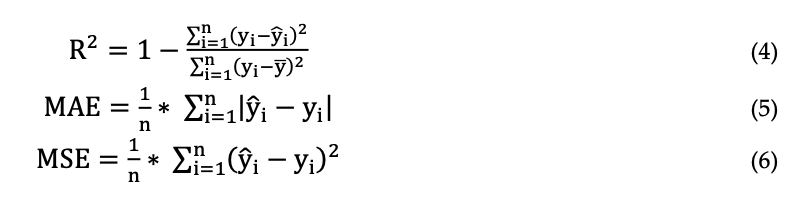
Before calibrating KNN models and the empirical correlations, the multivariate outliers were removed from the dataset based on the methodology that uses Mahalanobis Distance (Filzmoser P., 2004) of the samples to data mean vector. Sequentially, the Bartllet’s test (Bartllet, 1951) was carried out to evaluate the applicability of data science techniques. Then, the dataset was divided into train dataset (80% of the samples) and test dataset (20% of the samples). Using the same train dataset, K- Nearest Neighbors (KNN) algorithm was applied to the data and Nkt, Nke and NΔu were calibrated, and then, the models were applied into the test dataset. The results were compared with the measured value from the VST by using the Coefficient of the Determination (R2), Mean Absolute Error (MAE) and Mean Squared Error (MSE).
KNN Method
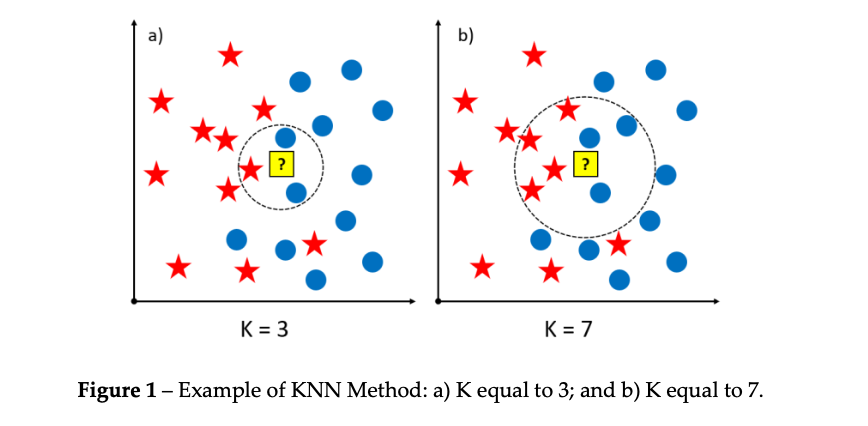
KNN method consists of a knowledge-based system model and it is a Machine Learning (ML), which considers prior information in order to make predictions/classification applying in new data (unseen values). The KNN model measures the distance between an input variable (x0) and the input training dataset (xtrain) and select the “x-K” closest observations (xk). The output variable (y0) is predicted as the mean value of the “y-K” closest values (yk) correspondent to the xk values. Depending on the “K” value adopted in the model, the result (classification/prediction) can be different, see Figure 1. Unknow value can be a blue dot by using a K equal to 3, or a red star by using a K equal to 7.
Error Metrics
To evaluate the performance of the generated models, it was calculated the Coefficient of the Determination (R2), Mean Absolute Error (MAE) and Mean Squared Error (MSE) by using the Equations 4 to 6. The R2 is commonly applied to evaluate the dispersion of the data, and the MAE/MSE is used to evaluate the distance of the predict value of the models from the real value (measured).
Bearing Capacity Factor Calibration (Nkt, Nke and NΔu)
To obtain Nkt, Nke and NΔu values from Equations 1 to 3, the train dataset was used to correlate the measurement of the CPTu data and Su from VST test. The bearing capacity factors were calculated in order to obtain the highest accuracy of the model, being the highest R2 and the lowest MAE and MSE.
RESULTS AND DISCUSSION
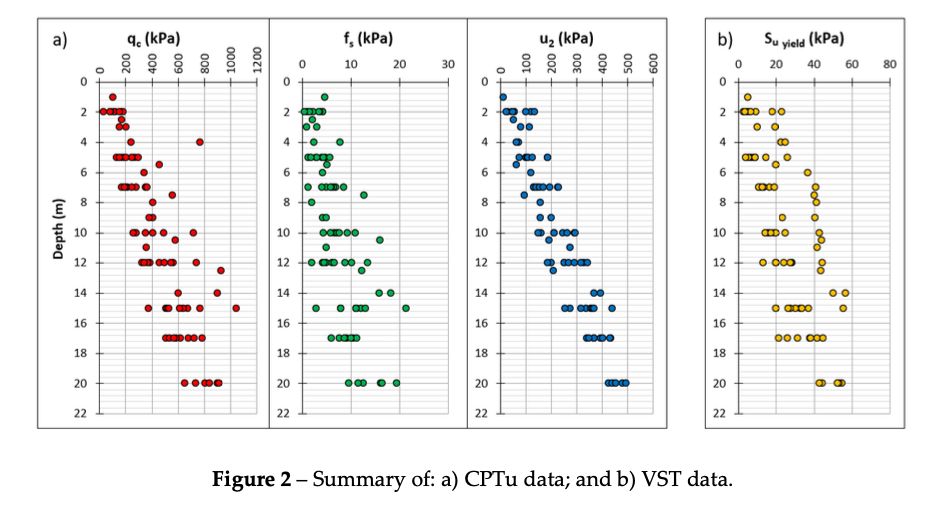
As obtained by laboratory tests, the studied bauxite tailings were classified as silty-clayed, with a silt percentage varying between 60% and 80%, according with grain size classification of ASTM D422 (ASTM, 2007). The obtained grain density presented a mean value equal to 3.10g/cm3. After the pre- processing of the CPTu and the VST data, the results of the bauxite tailing dataset is presented in Figure 2. Is possible to observe in Figure 3 that qc and u2 show a tendency of increase over the depth, a common behaviour of a homogeneous material. Despite natural dispersion of the Su and fs values, the tendency to increase with depth is also notable.
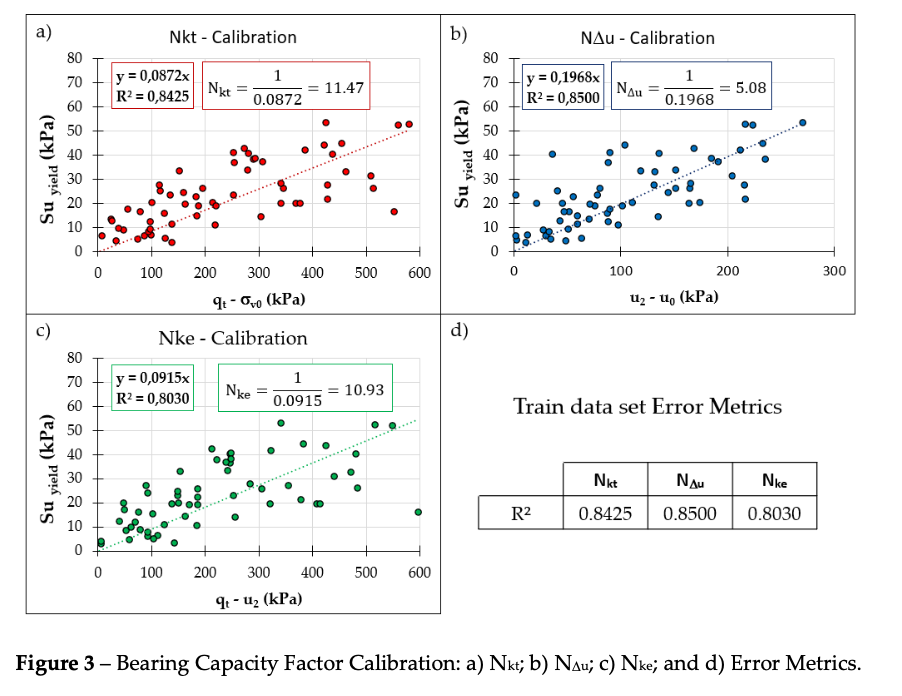
Before application of KNN algorithm, Bartllet’s test was performed. It was obtained a p-value equal 1.76 x 10-178 by 4 Degrees of Freedom and a statistic of x2 equal to 9.48. The p-value is lower than the significance levels of 5% (1.76×10-178 << 0.005), thus KNN is applicable. After remove of the multivariate and split of the dataset into train and test subsets, bearing capacity factors were calibrated as shown in the Figure 3. The obtained values were Nkt = 11,47 NΔu = 5,08 and Nke = 10,93.
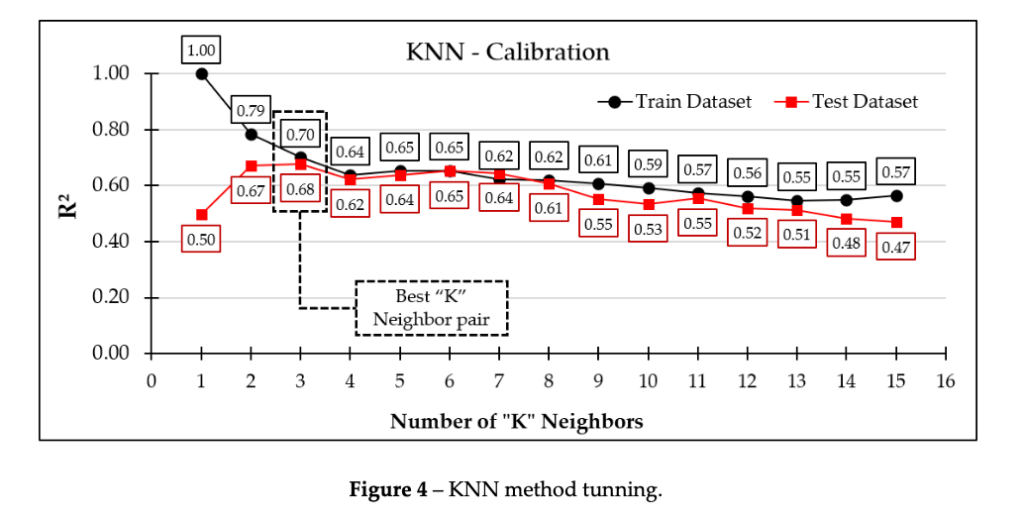
Based on the train data set used to calibrate the bearing capacity factors and the test dataset, KNN method was applied in order to obtain the best “K” neighbor value. In the KNN model calibration, it was necessary the use of the test dataset to choose of the best “K” value, in order to evaluate problems related to overfitting (R2train >> R2test) and underfitting (R2train << R2test). Using the same error metrics of the bearing capacity factor calibration, and varying the “K” values from 1 to 15, the best “K” value obtained is K = 3 as shown in Figure 4.
The calibrated models were applied into the test data set to obtain the predict Su values and compared with the measured values from VST. Figure 5 shows the boxplot and the statistical summary of the models and the comparison with the measured VST data.
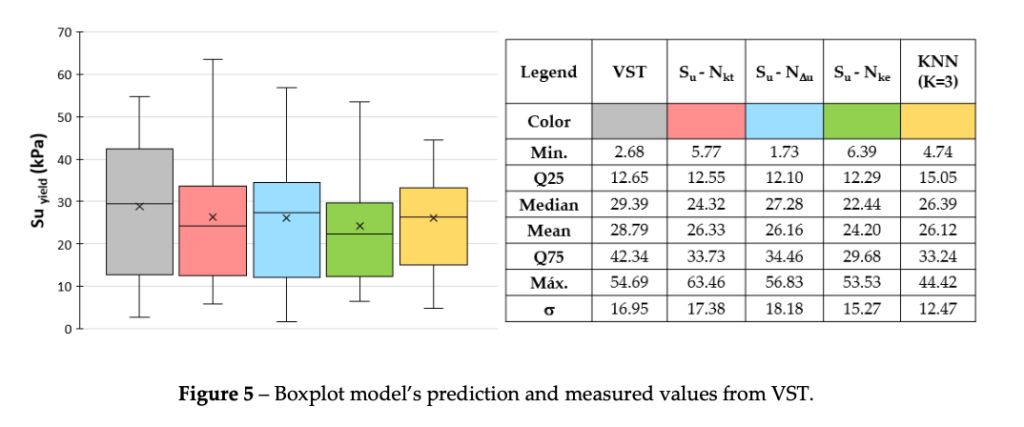
As can be seen, the mean values obtained from the models are almost the same of the measured value from the VST. However, is important to note that KNN model predicted Su values with low dispersion as seen by the extremes of the boxplot and the lowest standard deviation (σ) if compared with the bearing capacity factors models and also the measured values from the VST. The next step was the evaluation of the error metrics (R2, MAE and MSE) for bearing capacity factors and KNN models. Figure 6 shows the comparison of the train dataset error metrics to each model.
Analyzing the Figure 6, it is possible to note that KNN model presented the lowest value of MSE if compared with all bearing capacity factor methodology (Nkt, NΔu, and Nke), indicating the lowest Su dispersion if compared with the other methodologies. The R2 values obtained from KNN and NΔu models are almost the same reaching 0.71, being higher than the Nkt and Nke models (R2 = 0.63). The comparison of the MAE values shown a higher dispersion of the results of the Nke if compared with the KNN and the Nkt and NΔu models.
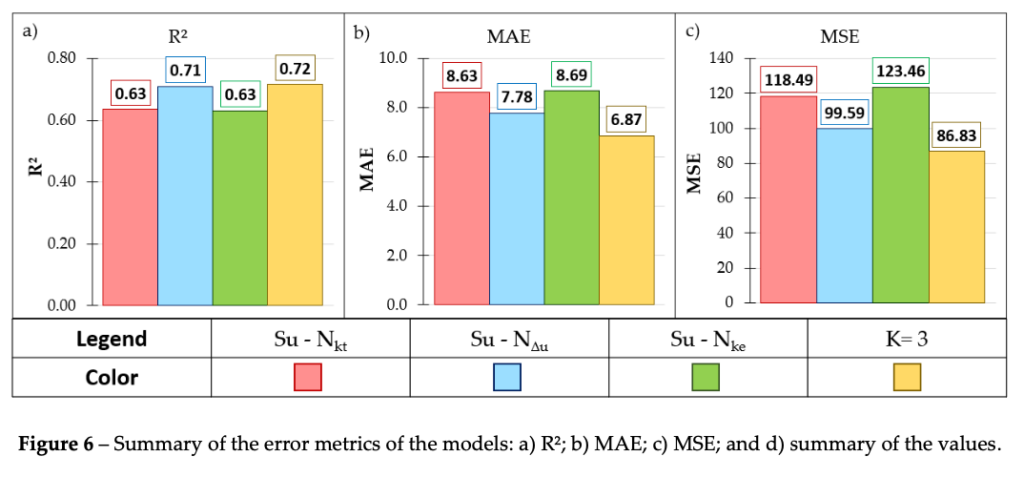
Comparing the results with literature, Abu-Farsakh & Mojumder (2020) reached to the same conclusion by the application of the Artificial Neural Network (ANN), another data science technique, to predict Su values of a natural soil by using CPT data and measured values from unconfined triaxial test (UU). The author obtained R2 equal to 0.84 and 0.77 to the ANN model and the Nkt model, respectively, by using Nkt=15.9. Besides the difference of the techniques and the material, the data science techinics has proved its value as an important tool to evaluate Su.
CONCLUSION
Application of data science techniques in geotechnical problems can provide site specific models that can be used to predict tailings parameters more accurately than empirical correlations developed based on limited data from other material and conditions, especially with large datasets. Based on the calibrated KNN model with raw CPTu data presented, it is shown that data science technique was capable of provide reliable results, reaching better results with low dispersion than the empirical correlations when applied to predict the undrained shear strength. KNN is a simple ML algorithm and it can be easily calibrated, providing a great tool to geotechnical test analysis.
ACKNOWLEDGEMENTS
The authors thank Pimenta de Ávila Consultoria, Universidade Federal de Ouro Preto (Brazil), and the Programa de Pós Graduação de Engenharia Mineral (PPGEM, Brazil) for all the support in the development of this work.
NOMENCLATURE
qt Total cone resistance (qt = qc+(1-a) x u2);
σv0 Total vertical stress;
u2 Excess of porepressure generated during the cone drilling;
u0 Equilibrium porepressure;
Su Yield undrained shear strength;
yi Measured Su value from VST;
?̅ Mean Su value from VST;
ŷi Predicted Su value from the models;
n Number of measurements;
xtrain Input training dataset;
xk “x-K” closest observations;
y0 output variable;
yk “y-K” closest values;
K Number of Neighbors;
REFERENCES
Abu-Farsakh, M.Y.; Mojumder, M.A.H. (2020) Exploring artificial neural network to evaluate the undrained shear strength of soil from cone penetration test data. Transp. Res. Rec. J. Transp. Res. Board. 2674, 11–22.
American Society for Testing and Materials – ASTM (2015). D2573: Standard Test Method for Field Vane Shear Test in Cohesive Soil. West Conshohocken, PA 19428.
American Society for Testing and Materials – ASTM (2007). D422-63: Standard Test Method for Particle-Size Analysis of Soils. West Conshohocken, PA 19428-2959.
American Society for Testing and Materials – ASTM (2020) D5778: Standard Test Method for Electronic Friction Cone and Piezocone Penetration Testing of Soils. West Conshohocken, PA 19428-2959.
Bartlett M.S., (1951) The effect of standardization on a chi square approximation in factor analysis. Biometrika, 38:337– 44.
Global Industry Standard on Tailings Management – GISTM (2020), Global Tailings Review, International Council on Mining & Metals (ICMM), UN Environment Programme (UNEP) and Principles for Responsible Investment (PRI).
Lunne, T.; Robertson, P.K. & Powell, J.J.M. (1997) Cone Penetration Testing in Geotechnical Practice. 1o Edition. Abingdon: E & FNSpon Press.
Ly, Hai-Bang & Pham, Binh. (2020). Prediction of Shear Strength of Soil Using Direct Shear Test and Support Vector Machine Model. The Open Construction and Building Technology Journal.
Filzmoser P. (2004). A multivariate outlier detection method. In Proceedings of the seventh international conference on computer data analysis and modeling, vol 1. Belaru-sian State University, Minsk,18–22.
Zhang, W.; Wu, C.; Zhong H.; Li, Y; Wang L.; (2021) Prediction of undrained shear strength using extreme gradient boosting and random forest based on Bayesian optimization. Geoscience Frontiers, Vol 12, Iss 1.
Para baixar o artigo em PDF, CLIQUE AQUI