
Guilherme H. S. Pinto & Pedro M. Rocha
Pimenta de Ávila, Nova Lima, Minas Gerais, Brazil
Hugo A. Brandão
Pimenta de Ávila, Nova Lima, Minas Gerais, Brazil
Rodrigo R. V. de Oliveira
Pimenta de Ávila, Nova Lima, Minas Gerais, Brazil
ABSTRACT: After the Brumadinho’s incident, many of Brazilian’s dams Factor of Safety (F.S.) were reviewed and considered unfit to operate, showing the necessity of reinforcement. The evaluation of the reinforcement construction in large dams is a key aspect to be observed, mainly while the dam is operational when the excess porewater pressure generated during the process and the deformation occurred by the loading could compromise the structure integrity. The present work aiming to evaluate the F.S. of a downstream dam in two conditions: (i) the current condition of the dam, using different failure surfaces, comparing the F.S. obtained with CDA and Brazilian regulators recommendations; and (ii) evaluation of a buttress construction to reinforce the structure, analyzing the excess of porewater pressure generated and the deformation in the foundation soil during and after construction. The results show the necessity of the compare the potential failure surface geometry since the F.S. of the circular surface meets the minimum F.S. established by the regulations in the opposite of the non-circular (more critical). Also, the foundation displacement after the consolidation phase is significant and must be evaluated in the case of liquefaction potential.
1 INTRODUCTION
One way of evaluating a tailings dam stability is the Factor of Safety (F.S.) that can be defined as the relation between resistance shear stress and acting shear stress (Duncan & Wright, 2005). There are different methods to calculate the F.S. as the Shear Strength Reduction (SSR) and, the most used, is the Limit Equilibrium Method (LEM). Commonly, the LEM method is employed with the Morgenstern and Price method which considers the equilibrium of forces and momentums, by assuming an interslice force using a function, for example, a half-sine function (Morgenstern & Price, 1965).
To evaluate dam stability, it is essential to define the minimum F.S.. This value must be defined based on the uncertainties of the structure in hand, the information available, and the dam in situ characteristics such as soil parameters, porewater pressure conditions. Actually, the regulations and recommendations establish a minimum value of factor of safety based on each stage of a dam life cycle (e.g. end of construction, operation and closure).
The Brazilian Standard recommends, in the guideline ABNT NBR 13028 (2017) for dam designs, that the minimum F.S. value for an operating dam is 1.50 (F.S.min≥1.50), and that the designer must define whether to consider drained or undrained parameters. The Brazilian National Mining Agency (ANM) published in 2019 resolution No.13 that defines the minimum F.S. of 1.30 (F.S.min≥1.30) when considering undrained parameters. Finally, the Canadian Dam Association (CDA) published in 2019 a guideline for dam operation, construction, and recommended a minimum F.S. of 1.30 (F.S.min≥1.30) during/after the construction and 1.50 (F.S.min≥1.50) to normal operations conditions. Table 1 summarizes the minimum F.S. recommended by ABNT (2017), ANM (2019) and CDA (2019).

Besides the minimum F.S., none of the indications, be it recommendation or regulation, highlight the importance of the correct evaluation of the probable failure surface. As shown by Brandão et. al (2020), depending on the geometry cross-section analyzed, the F.S. can variate from 1.50 to 1.21 depending on the failure surface choose by the user, being optimized or not using LEM. This can mislead the stability characterization of the structure, being necessary the correct evaluation of the most critical potential failure surface. Also, the authors have shown that the shape and F.S. of the non-circular optimized surface are similar to the evaluated by the SSR method, which does not depend on the user’s choice of the failure surface.
The incidents in Brumadinho and Fundao have shown the necessity of reassessing the safety of tailings dams, especially those raised upstream, reviewing soil parameters and also the methodology of the analysis. As described by Brown & Gillani (2016), some wrong assumptions in the evaluation of the soil behavior could mislead the correct evaluation of the structure condition, for example, the Mount Polly (Canada) failure in 2014 occurred due to a consolidated undrained shear failure after the construction. Also, the authors highlight the importance of considering constructive porewater pressures, showing an example in which the F.S. was 2.16, showing an idea that the structure would be stable but using wrong assumptions, to 0.66 using the correct shear strength envelope indicating the failure of the structure.
When these structures did not meet the recommendations, it is necessary to reinforce them. One possible solution can be the construction of a reinforcement buttress. In the case of such types of constructions, one important aspect to be evaluated during the project phase is the generation of porewater pressure excess during the construction period and the displacements, which can compromise the dam safety, as described in detail by Ladd (1991). These evaluations often go unnoticed at the design stage and can lead to catastrophes such as the Cadia failure in 2018.
As reported by Jefferies et al. (2019), the Cadia failure can be described in two phases: (i) Phase 1 incorporates all of the precursors of the failure. The displacement of this phase was slow, and the mass adjusted to changing states of the equilibrium state; (ii) Phase 2 incorporated the sudden losses of resistance of the foundation soil and/or loading increases by the buttress construction, to create conditions to accelerate movements and displacement that lead the structure to fail. As described in the report, the movements accelerated after 2018, and it was possible to correlate with the Stage 1 Buttress construction before Phase 2. The excess of displacement in the downstream triggered a liquefaction mechanism as detailed in the report.
Based on this, the present article has the objective to evaluate the F.S. of a downstream dam using different failure surfaces, optimized and not, and compare the results with the minimum F.S. of different references, as detailed in Table 1. Also, the displacements and the excess of the porewater pressure (generation and dissipation) were evaluated during and after the construction.
2 METHODOLOGY
The objective of the present work is to evaluate the factor of safety of a downstream dam, compare the results with the recommended values by ABNT (2017), ANM (2019) and CDA (2019) (summarized in Table 1) and simulate a reinforcement buttress construction. To evaluate the F.S. it was performed seepage and stability analysis using SEEP/W and SLOPE/W software and the buttress construction was performed with stress-strain analysis using SIGMA/W software developed by Seequent.
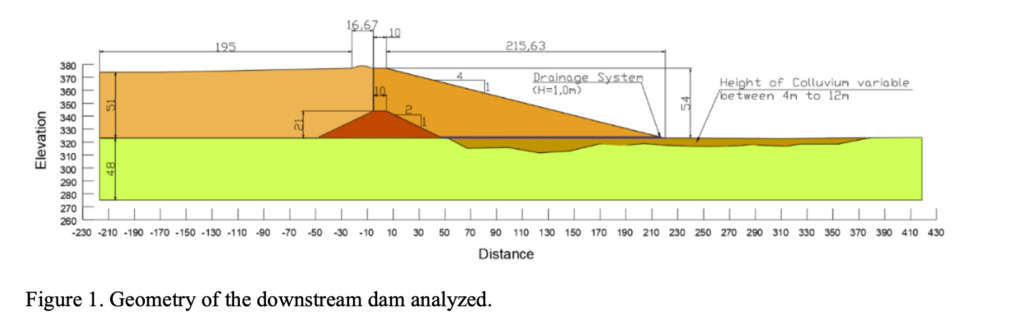
Figure 1 shows the geometry model of the downstream dam in the initial condition. The starter dike was designed with a 1H:2V slope and the dam heightening with a 1H:4V slope. The heightening was constructed with tailings underflow. All the overflow was deposited on the tailings’ reservoir creating a tailings beach. The structure has a 1m thick drainage system composed of sand and gravel. The material properties used in the LEM analysis and the materials identifications used in the model are presented in Table 2.

To evaluate the F.S. using the LEM in the initial condition (without buttress) a coupled analysis was performed using SLOPE/W and SEEP/W. The Morgenstern – Price / GLE (MP-GLE) method was applied, mainly because it satisfies the force and momentum equations (Morgenstern & Price, 1965), using a function to estimate the interslice force, for example, a function half-sine used in the present work. As described by Duncan & Wright (2005) and Brown & Gillani (2016), this methodology is precise and applicable to almost all types of slope geometries and stratigraphic profiles, in circular and non-circular surfaces.
The initial stability analysis was performed considering four different types of surfaces: (i) circular; (ii) circular optimized; (iii) non-circular; and (iv) non-circular optimized. The optimization process consists in dividing the slip surface into several segments and moving the vertices of each segment randomly, based on the Monte Carlo algorithm, until the lowest safety factor is found (GEP-SLOPE, 2015).
To evaluate the permeability and the volumetric content variation about the matrix suction a saturated/unsaturated behavior was adopted to all materials. Also, the assumption of saturated/unsaturated behavior is close to in situ conditions. Using the material properties available in the SEEP/W library, the volumetric water content and the soil permeability were interpolated defined based on the suction matrix, using the Van Genuchten methodology, as detailed in Figure 2.

To simulate the buttress construction, SIGMA/W was used considering linear elastic parameters as detailed in Table 3. The buttress was simulated considering the same strength parameters as the compacted landfill ( = kN/m3, c’=15 and Φ=30o, ksat = 3e10-6m/s).

Based on the stress state and the porewater pressure calculated on SIGMA/W, the F.S. was evaluated without the interactive process to obtain the normal forces between slices, denominated in this paper as Finite Element Method (FEM). The results were compared with the LEM MP- GLE method with the construction porewater pressures coupled analyzes. Both the F.S. were evaluated on time, analyzing the porewater pressure dissipation, considering all construction stages and the period after the construction.
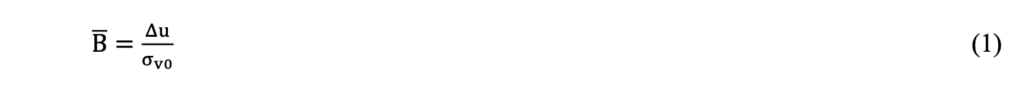
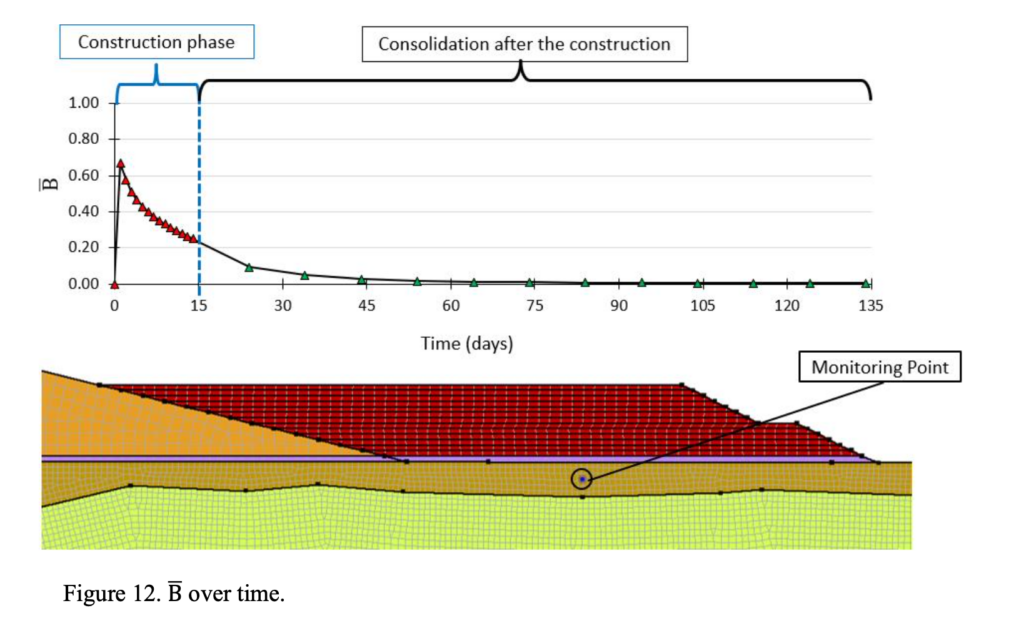
Also, the porewater pressure generated during construction was evaluated using the B parameter, calculated with Equation 1, in a specific point in the middle of the Colluvium Soil (loose clayey soils). Finally, the displacements in the colluvium layer were evaluated along the entire length of the buttress, after the dissipation of the porewater pressure and the colluvium consolidation.
3 RESULTS
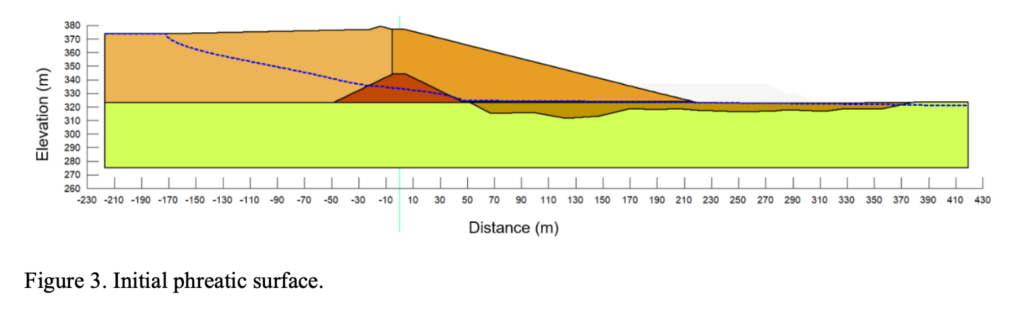
The first step is to obtain the F.S. is the correct evaluation of the seepage analysis modeled using SEEP/W. Appling a total head boundary condition in the model upstream and downstream, and a drainage boundary condition in the drainage system, the initial phreatic surface was obtained as shown in Figure 3.
As described in item 2, the seepage model was performed using a saturated/unsaturated model, to better simulated the material’s behavior. As detailed in Figure 4, the underflow material presented a saturation degree varying from 0,10 up to 0,15 and the overflow presented higher saturation values varying from 0,25 up to 0,45. These values are consistent with the expected behavior of these materials, with overflow being a low permeability material (smaller particles) and underflow a material with higher permeability (larger particles).

Considering this model, the initial safety conditions of the structure were evaluated. The summary of the F.S. calculated is shown in Table 4. There are significant differences between the F.S. values obtained for different types of failure surfaces. Figure 5 shows the circular surface with an F.S. of 1.59 which meets the recommended values by ABNT (2017), ANM (2019) and CDA (2019). Sequentially, Figure 6 shows the non-circular surface with an F.S. of 1.44, Figure 7 shows the optimized circular surface with F.S. of 1.39, and Figure 8 shows the optimized non- circular failure surface with an F.S. of 1.35, which meet only the ANM (2019) F.S. criteria.
As described by Brandão et al. (2020), a comparison between the failure surfaces shows the importance of a proper selection of the correct failure surface to assertively assess the dam F.S.. The low resistance colluvium layer under the dam creates a preferential path to develop the failure surface and this condition has a direct influence on the selection of the slip surface type. As shown by the results, Figure 5 to Figure 8 the non-circular optimized failure surface presented the lowest F.S..
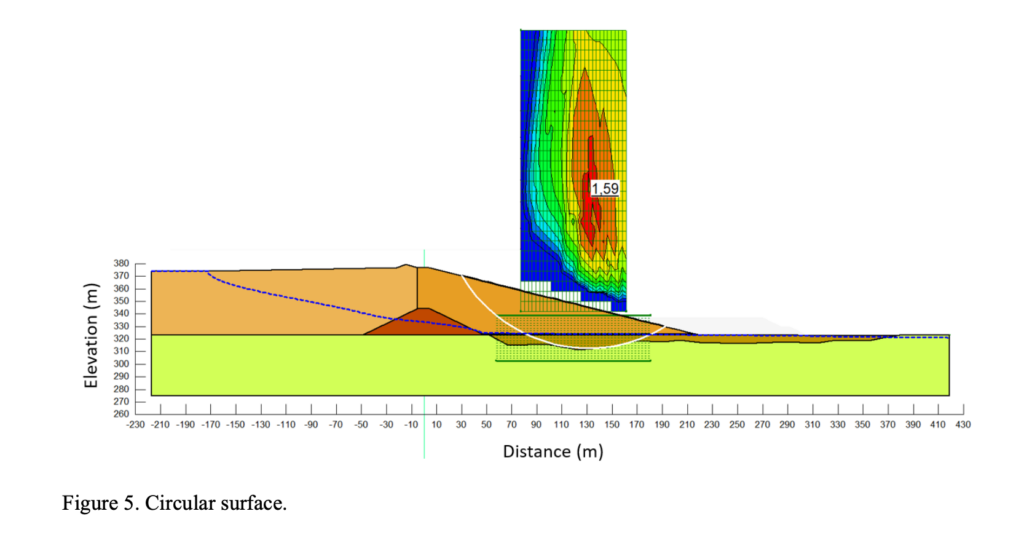
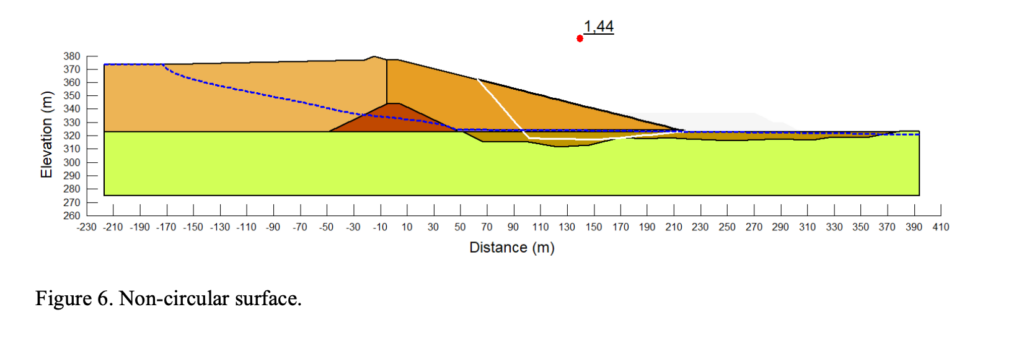
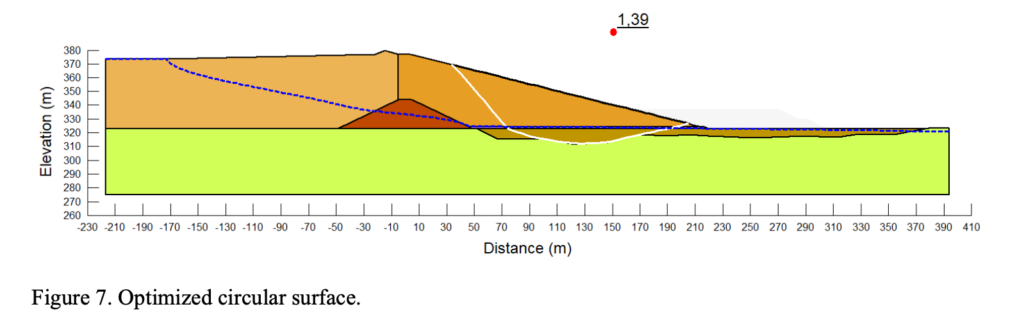

Table 4 shows the F.S. summary and the comparison with the regulations previous cited: ABNT NBR 13028 (2017) with F.S.min≥1.50, Resolution No. 13 (2019) F.S.min≥1.30 and CDA (2019) F.S.min≥1.50 to normal dam operation.

Considering current Brazilian legislation and recommendations, this structure would meet the minimum F.S. established on ABNT NBR 13028 (2017) only if considered a circular failure surface (F.S.≥1.50). When considering non-circular and optimized failure surfaces, circular and non-circular, the structure would meet the minimum F.S. established only by resolution No. 13 by ANM (2019) with F.S.≥1.30, but would not meet the minimum F.S. established by ABNT
NBR 13028 (2017). Considering the CDA (2019) and the F.S.min≥1.50., the structure only meets the minimum F.S. established to the circular failure surface.
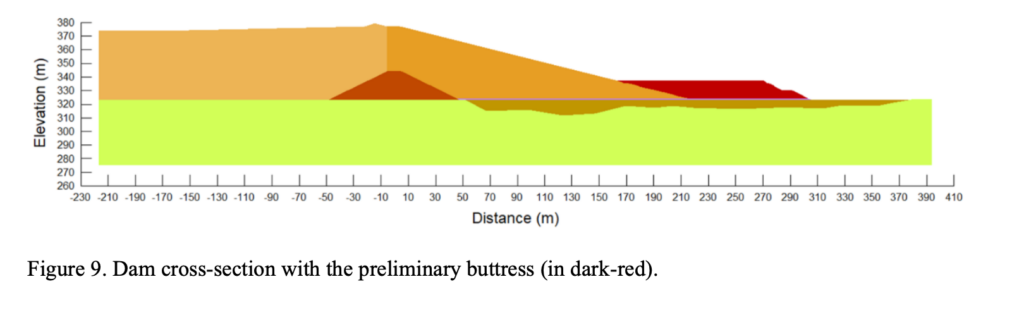
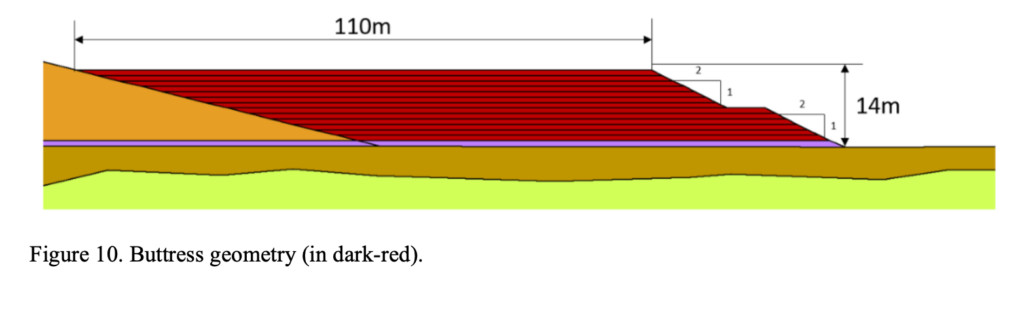
Thus, to meet the requirements established by ABNT NBR 13028 (2017) and by CDA (2019), the dam must be reinforced, to achieve an F.S. higher than 1.50, being the criterion adopted in this article. Figure 9 and Figure 10 show the buttress geometry.
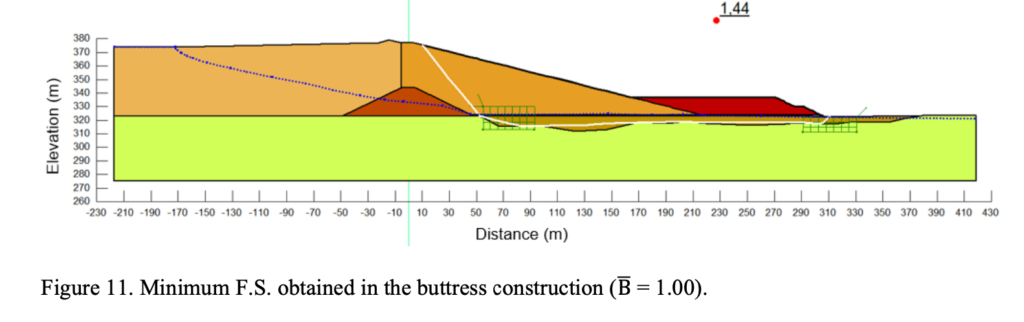
The porewater pressure generation during construction in the low resistance colluvium was simulated considering B equal to 1.00 to define the preliminary geometry. This value assumes that the porewater pressure excess is equal to the total stress, being possible to happen in loose saturated soils, in this example the colluvium layer under the phreatic surface. The calculated F.S. LEM considering a non-circular optimized failure surface is equal to 1.44 as detailed in Figure 11.
Using SIGMA/W to model the buttress construction, the excess porewater pressure generation during and after the construction and the displacements in the colluvium layer were evaluated. The buttress was divided into fourteen layers with 1.0m thickness constructed in 1 day, resulting in two weeks construction period. The consolidation phase, after the construction period, was simulated over 120 days to verify the porewater pressure dissipation and the F.S. variation.
Figure 12 shows the variation of B overtime at a single point in the middle of the colluvium layer. The highest B found at the beginning of the buttress construction was 0.67 and it is decreasing over time, especially after the end of the construction. Approximately 60 days after the end of construction B is equal to 0 indicating the final dissipation of the generated pore pressure.
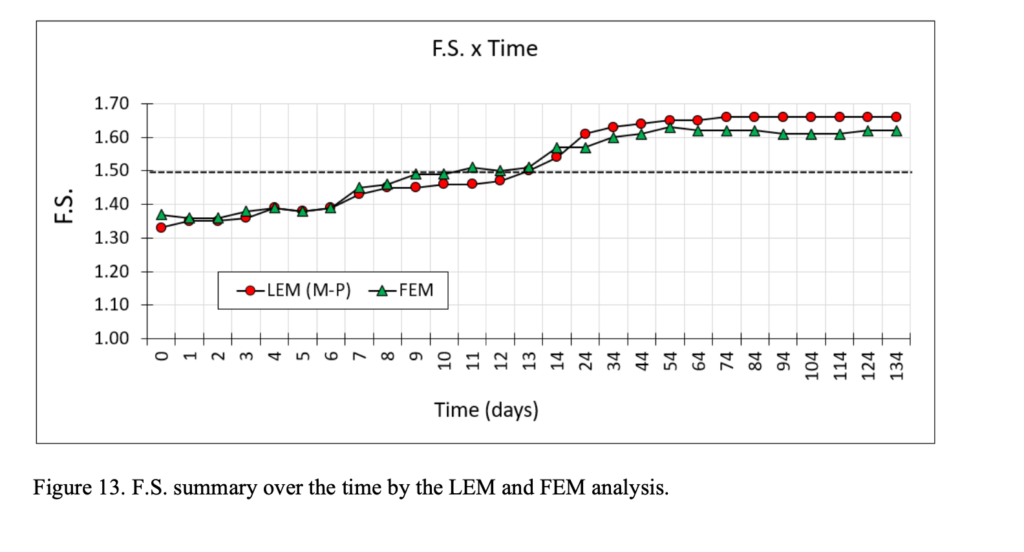
The F.S. was calculated during and after the construction time as summarized in Figure 13. To evaluate the F.S. it was considered the LEM analyses using the Morgenstern-Price method using a half-sine function to calculate the interslice forces and the FEM method with the SIGMA/W stress state.
Figure 13 shows that at the beginning of the construction, due to the high generation of porewater pressure, the calculated F.S. is lower than 1.50. At the end of the construction, 14th day, the porewater pressure dissipates and the calculated F.S. becomes higher than 1.50 and reached the maximum of around 1.65 after 55 days, approximately, for both methodologies.
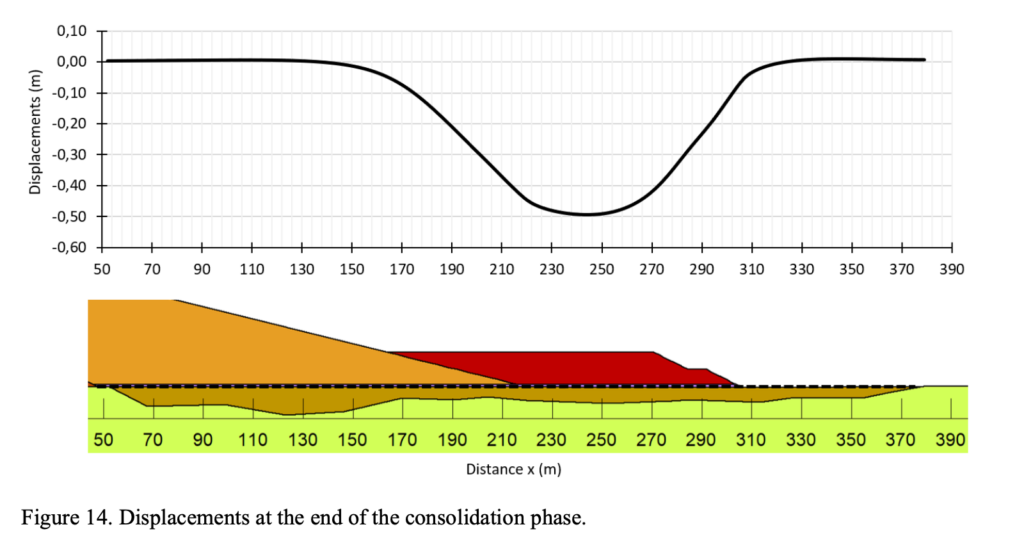
Finally, the displacements in the colluvium layer, between the drainage system and the low resistance soil, were evaluated to the end of the consolidation after the construction phase, as the results shown in Figure 14. Around the horizontal distance of 230m to 250m, the vertical displacements found in the colluvium layer after the construction is near 0.50m. In the model analyzed, the displacement of 0.50m did not cause the sectioning of the drainage system, which could lead the structure to fail. Also, the displacement evaluation is extremely necessary for a tailings’ storage facility with liquefaction risk, in which little displacements can trigger a liquefaction process, similar to the Cadia failure (Jefferies et al. 2019).
4 CONCLUSION
As shown by the results, the selection of the potential failure surface type is essential to evaluate the Factor of Safety. When considering only the circular surfaces, the F.S. can be misleading the structure condition stability and creating a situation where the real F.S. value is lower than the recommended values. In the presented work, the minimum F.S. was met only by the circular surface based on the ABNT (2017) and CDA (2019) values. The optimized non-circular surface presented the lowest F.S. value equal to 1.35, which did not meet ABNT (2017) and CDA (2019) criteria for operating dams.
Based on the results, the simulation of the construction of a reinforcement buttress was performed to stabilize the dam. The F.S. calculated during and after the construction are higher than the initial condition and, after the end of the construction, the calculated F.S. values are higher than 1.50 meeting the F.S. criteria adopted (F.S.min≥1.50). The highest B found in the analysis was 0.67, lower than the initial adopted value of 1.00. The displacement observed at the end of construction and the colluvium consolidation would not cause the sectioning of the drainage system, which could lead the structure to fail. Also, is highlighted the importance of the displacement evaluations in structures with liquefaction potential.
5 ACKNOWLEDGMENTS
The authors thank Pimenta de Ávila Consultoria for all the support in the development of this work.
6 REFERENCES
Brandão, H.; Oliveira, R. R. V; Almeida, L. F.; Pinto, G. H. S.; 2020. A comparative study of methods used to determinate the factor of safety. Tailings and Mine Waste.
Brown, B. & Gillani, I. 2016. Common errors in the slope stability analyses of tailings dams. In PM Dight (ed.), Proceedings of the First Asia Pacific Slope Stability in Mining Conference, Australian Centre for Geomechanics, Perth, pp. 545-556.
Duncan, J. M.; Wright, S. G. (2o ed). 2005 Soil Strength and Slope Stability, Hoboken: Wiley. GEO-SLOPE. 2015. Stability Modeling with SLOPE/W An Engineering Methodology. Calgary: Canada. Jefferies M; Morgenstern, N. R.; Zyl, D.V.; Wates, J.; 2019. Report on NTSF Embankment Failure Cadia
Valley Operations for Ashurst Australia. H356804-00000-22A-230-0001.
Ladd, C. C. 1991. Stability evaluation during staged construction. 22nd Terzaghi Lecture, Journal of
Geotechnical Engineering., ASCE, 117(4),537-615.