
Hugo A. Brandão*, Tatiana B. Santos2, Christiane S. de Oliveira 3 and Ana P. F. Costa
- Geotechnical Department, Pimenta de Ávila, Brazil, Innovation Coordinator and Geotechnical Engineer, hugo.assis@pimentadeavila.com.br and (+55 31) 99912-1993
- Mining Engineering Department, Federal University of Ouro Preto, Brazil, Professor, tatiana.santos@ufop.edu.br, (+55 31) 97566-7590
- Geotechnical Engineering Department, Gorceix Foundation, Brazil, Graduate Student, christiane.oliveira@samarco.com and (+55 31) 98735-2113
- Geological Department, Pimenta de Ávila, Brazil, Geological Engineer, ana.felix@pimentadeavila.com.br and (+55 31) 99148-6084
ABSTRACT
The number of reported incidents associated with tailings storage facilities (TSFs) has increased in the past few years. It is estimated that the reported failures between 1915 and 2022 resulted in the loss of life of more than 2.650 people and more than 250 million of m3 of residue released to the environment. Dam monitoring provides engineers important information that can be used to better understand the TSF behaviour and the current practice relies primarily on visual and manual analysis. Due to instruments automation, large sets of data are being generated and visual/manual analysis leaves much to desire when applied to anomaly detection on large data sets. Machine learning and statistical models can be used to pre-screen anomalies and provide information to engineers, helping the TSF operational team with real-time monitoring. This paper presents a methodology to identify anomalies based on predictive models and the obtained residues. First, the k-nearest neighbours (KNN), a machine learning model, was used to predict future readings of a piezometer based on the last reading. The calibrated model presented R2 values over than 0.91, RMSE near to 0.16 m and MAE values equal to 0.10 m. After the prediction of pore pressure values, the residues based on the difference between the predicted and real values were calculated. They were used to identify the anomalies in the data. A statistical distribution associated with a 95% interval of confidence and local outlier factor (LOF) method were applied. The LOF method presented the best results and not only it was able to identify the same anomalous readings of the statistical distribution, but it also identified other anomalous data points.
INTRODUCTION
Mining operations have a large impact in the environment and society and generate large amounts of tailings during the ore extraction process that are commonly stored in Tailings Storage Facilities (TSF). Between 1915 and 2022, 257 incidents related to TSF were reported that resulted in the release of approximately 250 Mm3 and loss of approximately 2.650 lives (Piciullo et al., 2022).
The monitoring of a TSF is crucial to promote the safe operation of the structure as it provides critical information about the TSF behaviour. This allows a better risk management and helps the operational team to reduce the probability of failure. The implementation of a monitoring plan is a legal requirement in many countries and recommended by the Global Industry Standard on Tailings Management (GISTM).
The pore water pressure (PWP) is one of the many variables that can be monitored in a TSF and it is related to several failures modes. By monitoring the PWP, the dam safety team can identify anomalous behaviour in advance that could lead to a TSF failure and providing the owner with time to act and reduce the probability of occurrence of the failure mode or reduce its severity (ICOLD, 2018).
The monitoring data can be used to better understand dam ́s behaviour based on deterministic and statistical models (ICOLD, 2018). Li et al. (2019) also presented the applicability of predictive models, such as time series and machine learning, in the analysis of monitoring data.
The automation of monitoring instruments has become a common practice as it provides more reliable and near real time information. It resulted in the generation of large sets of data that must be analysed in order to support the TSF operation. This task is often performed visually through chart analysis with low efficiency and high subjectivity.
This paper presents a general methodology applicable to anomaly identification based on two machine learning models, the k-nearest neighbours (KNN), a predictive model, and local outlier factor (LOF), an anomaly detection model.
METHODOLOGY
Figure 1 presents the applied methodology in this study. First, an exploratory data analysis was performed on the piezometer dataset. The dataset was then split into 80% training data and 20% testing data. The KNN model was calibrated and evaluated based on the evaluation metrics (R2, MAE and RMSE). The best fitted model was than selected and used to obtain the predicted values (yp) based on past readings. The absolute residue values ware calculated and the LOF model was applied in order identify the anomalies in the data.
 Figure 1 Applied methodology.
Dataset
The dataset is composed by the readings of PZA collected from 2013 to 2021 in a tailings dam. A total of 160 readings were registered in that time period. The 50% of the data was collected in regular intervals between 13 and 17 days. Based on the distribution of the interval between readings, 75% of the readings were made between 10 and 20 days.
FIGURA DOS DADOS
K-Nearest Neighbours (KNN)
The k-nearest neighbours (KNN), also known as lazy learner, is a simple machine learning model that set the value or class of a specific data point based on the distance between the data point and its “k” nearest neighbours. This distance can be calculated based on Euclidian, Manhattan or any other distance metric. The KNN model can be applied on regression and classification problems (Pedregosa et al., 2011). In regression problems, the value of the data point is estimated based on the mean of the k-neighbours. The KNN model can be calibrated by varying the number of neighbours “k” and evaluating the performance for each “k” value.
Local Outlier Factor (LOF)
The local outlier factor (LOF) model is an unsupervised machine learning model that can be applied to anomaly detection based on the density of point distribution. The anomalies are identified by calculating the distance between each data point to its neighbours and returning a degree of outlier- ness called local outlier factor (Breunig et. al, 2000).
Evaluation metrics
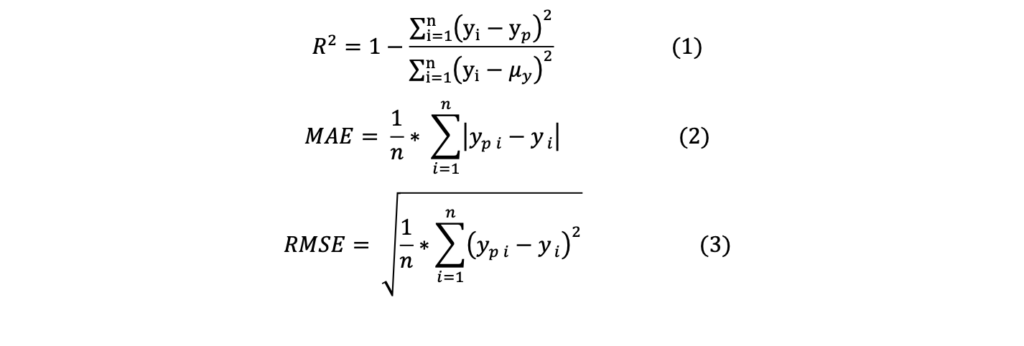
The models were evaluated based on the coefficient of determination (R2 – equation 1), mean absolute error (MAE – equation 2) and root of the mean squared error (RMSE – equation 3). R2 values ranges from 0 to 1, where models with good performance have R2 close to 1. MAE and RMSE have the same unit as the analysed data and represent the dispersion of the predicted values when compared to the real values. RMSE is more sensitive to outliers than MAE.
RESULTS AND DISCUSSION
An exploratory data analysis was performed on the piezometer dataset. The data has a very strong linear correlation of 0.97 between the current reading (instant t) and past reading (instant t-1). Based on this correlation, the KNN model was calibrated to predict the future reading based on the past reading value. It was also observed that 75% of the historical absolute values of the difference between readings were lower than 0.13m.
The KNN model was calibrated by varying the number of neighbours (“k”) from 2 to 40. Figure 2 presents the values of R2, RMSE and MAE for each value of k. Based on the results, the number of neighbours was set to 16 as it presented the best performance with R2 values of 0.94 and 0.91 for training and testing datasets respectively, RMSE mean value of 0.15m and MAE mean value of 0.10 for both datasets. Table 1 presents the R2, RMSE and MAE values for the KNN model considering 16 neighbours.
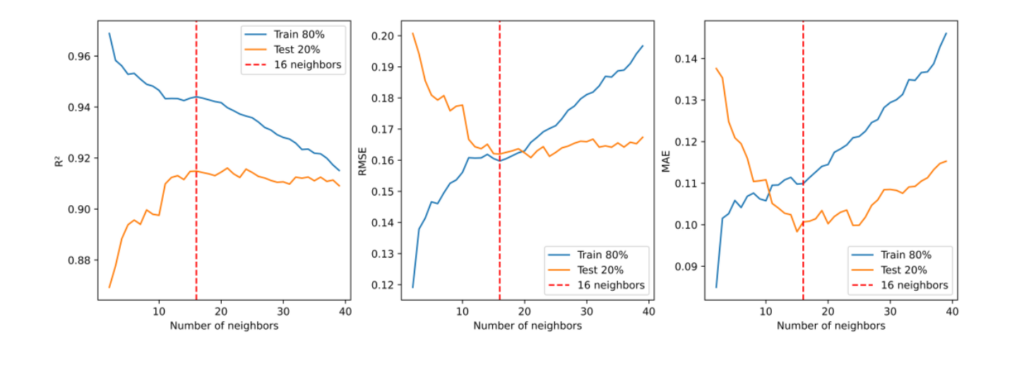
Figure 2 KNN calibration.
Table 1 R2, RMSE and MAE values for KNN model considering k = 16.

The best fitted KNN model was applied to predict the future (yp) readings base on the past reading (yt-1) and the absolute residual values (yr) were obtained based on the modulus of the difference between the predicted reading (yp) and real reading (y) at instant t. The absolute residual values were than analysed and, based on the correlation between the residual values (yr), real reading (y) and past reading (yt-1), the anomalies were identified through the application of the LOF model. Figure 3 and Table 2 presents the detected anomalies. All identified anomalies presented high differences between consecutive readings with anomalies ID 4, ID 7 and ID 9 having values outside the 99% range. None of the anomalies presented continuous anomalous behaviour in subsequent readings. Investigations should be performed to identify the origin of the anomalies.
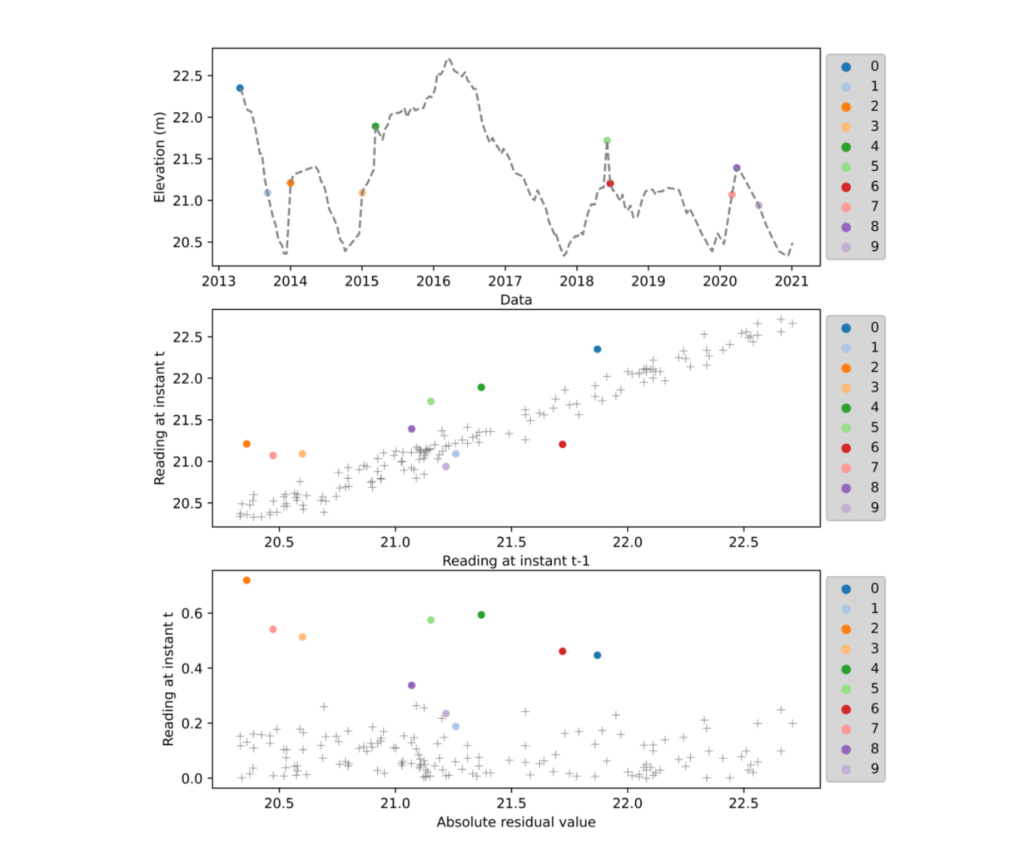
Figure 3 Identified anomalies.
Table 2 Detected anomalies based on LOF method.

CONCLUSION
The methodology presented in this article has demonstrated the potential of machine learning models, specifically the KNN and the LOF, in identifying anomalies in piezometer data. The results have shown that the KNN model associated with the LOF model can be applied to identify anomalies in piezo meter data. Therefore, this approach can be used as an prescreening tool for anomaly detection helping geotechnical engineers to detect potential problems in the instrumentation or an anomalous behaviour of the geotechnical structure. Furthermore, this methodology could be extended to other geotechnical problems and datasets and may provide valuable insights to the operational team.
ACKNOWLEDGEMENTS
The authors would like to thank Pimenta de Ávila, the Graduate Program in Mineral Engineering at the Federal University of Ouro Preto and CAPES for the support.
NOMENCLATURE
GISTM Global Industry Standard on Tailings Management
ID identification
k number of neighbours
KNN k-nearest neighbours
LOF local outlier factor
MAE mean absolute error
PWP pore water pressure
PZA piezometer
R2 coefficient of determination
RMSE root mean squared error
TSF tailings storage facilities
y real reading
yp future readings
yr absolute residual values
yt-1 past reading
μ mean value
REFERENCES
Breuning, M. M. et al. (2000). ‘LOF: Identifying Density-Based Local Outliers’, Association for Computing Machinery, New York, USA, p. 93-104, (viewed 06/04/2023, https://dl.acm.org/doi/10.1145/335191.335388)
GISTM. (2020) Global Industry Standard on Tailings Management. ICMM/UN/PRI, London.
ICOLD. (2018) Dam Surveillance Guide (Gide de la Surveillance). 1st Ed., ICOLD/CIGB, London.
Li, B.; Yang, J.; Hu, D. (2019). ‘Dam monitoring data analysis methods: A literature review’, Structural Control and Health Monitoring, v. 27, n. 3, p. 14.
Pedregosa, F. et al. (2011). ‘Scikit-learn: Machine Learning in Python’, Journal of Machine Learning Research, v. 12, p. 2825–2830.
Piciullo, L. et al. (2022). ‘A new look at the statistics of tailings dam failures’, Engineering Geology, v. 303, p. 106657.