
Cone Penetration Testing 2022 – Gottardi & Tonni (eds)
© 2022 Copyright the Author(s), ISBN 978-1-032-31259-0
Open Access: www.taylorfrancis.com, CC BY-NC-ND 4.0 license
Evaluation of flow liquefaction susceptibility of a sandy-silt tailings using the CPTu
M.P. dos Santos Junior & R. César Gomes
Universidade Federal de Ouro Preto, Brazil
S.G. Silva Ribeiro
GeoFast – Geotechnical Modelling, Brazil
B.G. Delgado
CONSTRUCT-GEO, Faculdade de Engenharia da Universidade do Porto, Portugal
ABSTRACT: Flow liquefaction is a behavior observed in saturated or nearly saturated geomaterials that show a strain softening response during undrained shear, most common in very loose sands and silts as well as very sensitive clays. In the mining industry, flow liquefaction is a subject of high relevance due to the geo technical characteristics of the tailings. Many methodologies have been developed to evaluate the susceptibil ity to flow liquefaction using in-situ tests, especially the CPTu test, since it provides high accuracy and good repeatability. This paper compares four methodologies based on the CPTu test to evaluate the susceptibility to flow liquefaction: i) Plewes et al. (1992), ii) Olson (2001), iii) Shuttle & Cunning (2008) and iv) Robertson (2016). The results obtained highlight the need to correct the original contour suggested by Olson (2001) for medium and high compressibility geomaterials. Furthermore, all other methods evaluated presented similar results in the overall classification.
1 INTRODUCTION
Casagrande (1975) showed that loose sands tend to contract during drained shear while dense sands tend to dilate under the same condition until it reaches the critical void ratio. If sheared under an undrained condition loose sands will generate positive excess porewater pressure, reducing the effective stress and, therefore, its shear strength, while the opposite would occur for dense sands.
Flow liquefaction is a behavior observed in satur ated on nearly saturated soils that show a strain soften ing response in undrained shear due to its contractive behavior under drained conditions, most common in very loose sands and silts as well as sensitive clays.
As shown in Figure 1 presented by Robertson & Wride (1998), sand-like soils that are looser than the critical state will generate positive excess porewater pressure and show a strain softening behavior in undrained shear, illustrated by the Strain Softening Condition (SS). If the state prior to shear is close to the critical state, these soils can experience a limited con traction, exhibited as a Limited Strain Softening (LSS) condition in Figure 1, also referred in the literature as quasi-steady state condition. If the soil is denser than the critical state, however, it will tend to exhibit a Strain Hardening (SH) behavior and the undrained strength will be greater than the drained strength.

Figure 1. Typical undrained monotonic behavior of sand- like soils in triaxial compression tests – Robertson & Wride (1998).
2 SUSCEPTBILITY TO FLOW LIQUEFACTION
This paper is going to evaluate the susceptibility of a sandy-silt tailings to flow liquefaction using the results of a Cone Penetration Testing (CPTu) per formed in the interior of a Tailings Storage Facility (TSF). Four methodologies will be used herein to evaluate the state of the tailings: i) Plewes et al. (1992), Olson (2001), Shuttle & Cunning (2008) and Robertson (2016).
2.1 Plewes et al. (1992)
Plewes et al. (1992) suggested a relationship between the slope of the critical state line (λ10) and the normalized friction ratio (F or Fr) as shown by Equation 1.
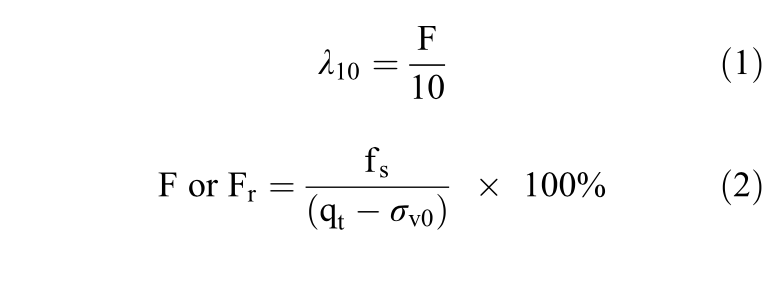
where:
fs = sleeve friction resistance
qt = corrected cone resistance
σv0 = total vertical stress
Once the slope of the critical state line (λ10) is determined the state parameter (ψ) can be calculated using the equation suggested by Shuttle & Cunning (2007).
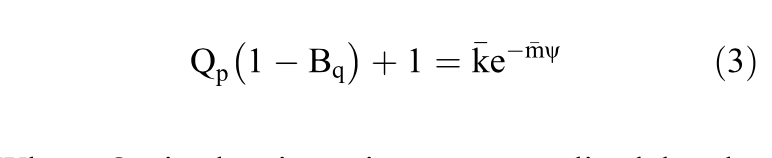 Where Qp is the tip resistance normalized by the mean affective stress (p’0) and Bq is the pore pres sure ratio, defined as shown below.
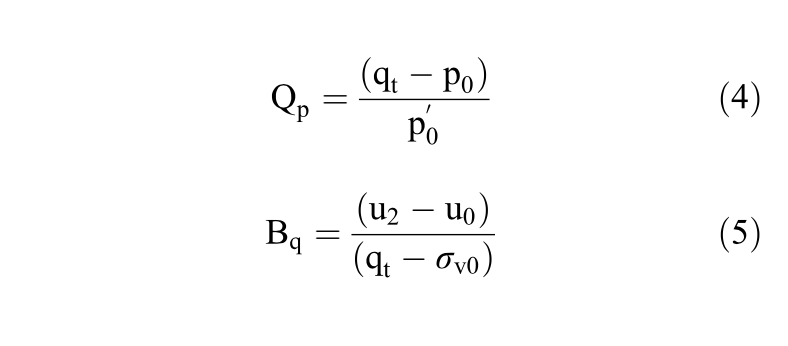
where:
u2= pore pressure measured behind the cone
u0 = in situ pore pressure
As a screening-level assessment, Jefferies & Been (2016) suggested that the effective inversion coeffi cients, kandmB, could be determined using Equation 6 and Equation 7, as a function of the slope of the critical state line.
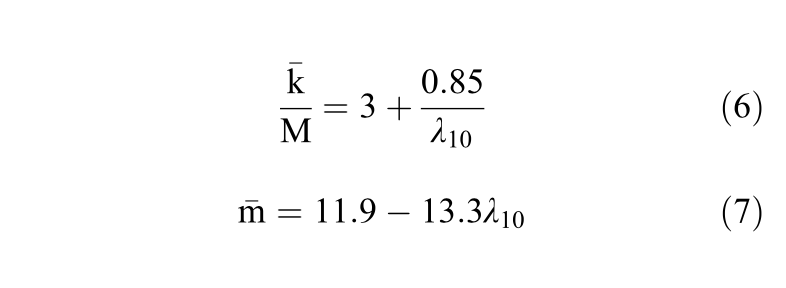 where Μ is the critical friction ratio (Μ=qc/p’c) and λ10 is the slope of the critical state line (CSL) measured in log10 p’ – e space. It was assumed Μtc=1,45 herein, using the average value of the range suggested by Jefferies & Been (2016).
2.2 Olson (2001)
Olson (2001) performed an extensive evaluation of 33 case histories of liquefaction flow failures and developed a comprehensive procedure to evaluate i) liquefaction susceptibility, ii) triggering of liquefaction and iii) post-triggering/flow failure stability.
In order to evaluate the susceptibility to flow liquefaction, Olson (2001) suggested the use of the contour proposed by Fear & Robertson (1995) based on the Standard Penetration Test (SPT). To convert the boundary from SPT to CPT, Olson (2001) used a relationship qc/N60=0.60, typical of clean sands, as shown in Figure 2.
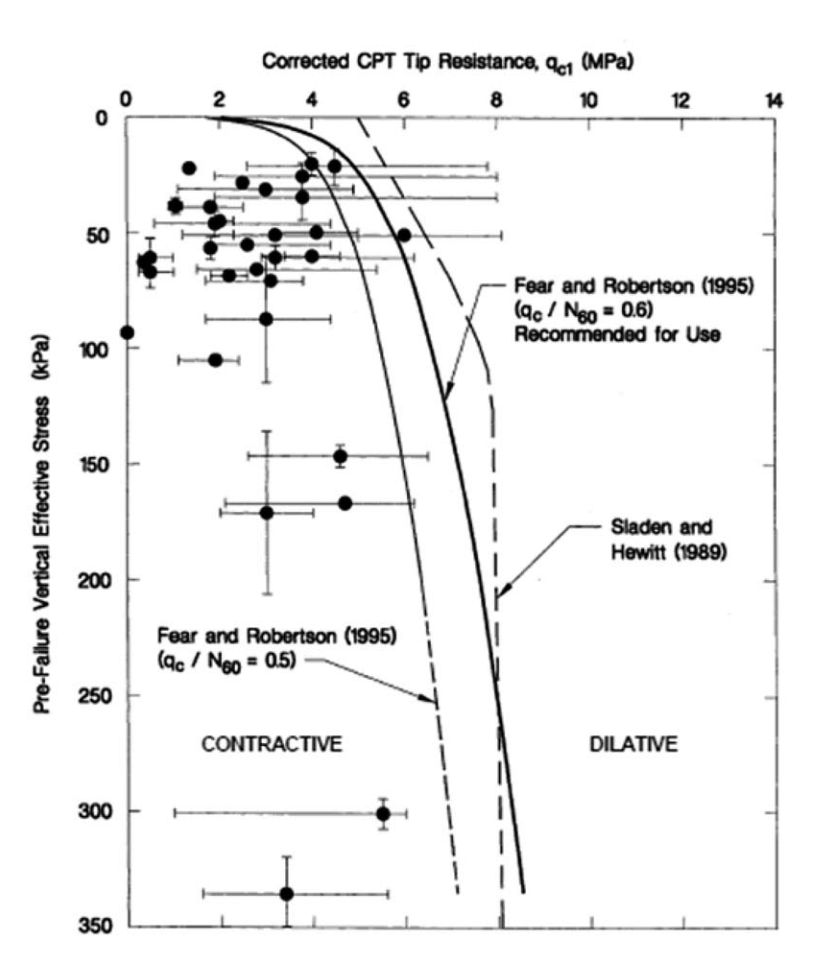
Figure 2. Boundary separating contractive from dilative behavior suggested by Olson (2001) to evaluate the susceptibility to flow liquefaction.
The contour proposed by the author to distinguish between contractive and dilative behavior is represented by Equation 8, based on the corrected tip resistance (qc1) and the vertical effective stress (σ’v0).

The corrected CPT tip resistance, qc1, is obtained as follows:
 where qc is the measured cone resistance and Cq is the CPT-based overburden correction factor sug- gested by Kayen et al. (1992), defined by Equation 10.
where Pa is one atmosphere of pressure in the same units as σ’v0.
Olson (2009) discussed the effect of compressibil ity on the evaluation of liquefaction susceptibility and suggested the use of the slope of the critical state line (λ10) to update the original boundary suggested by Olson (2001) as shown by Figure 3. According to the author, the original boundary should only be used for low compressibility soils (λ10~0.03) which is associated with the ratio of qc/N60=0.6. Many investi gators (Burland & Burbidge 1985; Jefferies & Davies 1993; Robertson & Campanella 1983; Schnaid & Odebrecht 2012; Stark & Olson 1995) demonstrated that the ratio qc/N60 is a function of soil type (usually expressed as a function of the mean grain size – D50).
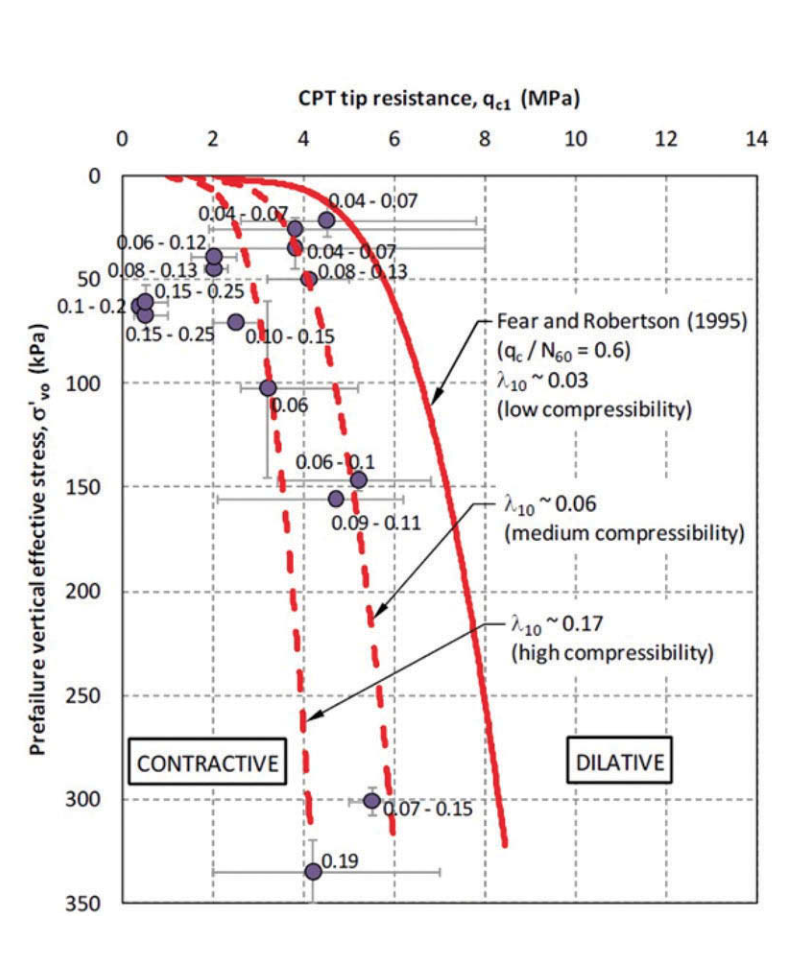
Figure 3. Contours suggested by Olson (2009) to separate contractive from dilative conditions for soils of low, medium and high compressibility.
This paper suggests the use of the ratio qc/N60 to account for the effect of compressibility and Equation 11 is suggested for this purpose.
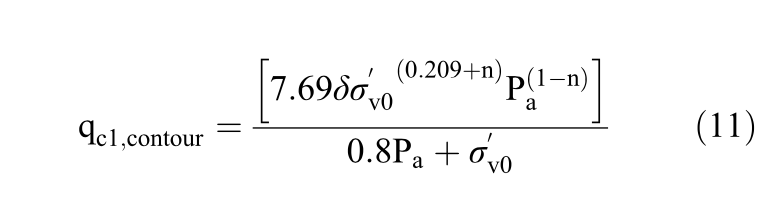
where δ = Ratio qc/N60.
To evaluate the susceptibility to flow liquefaction it is suggested the use of Equation 12.
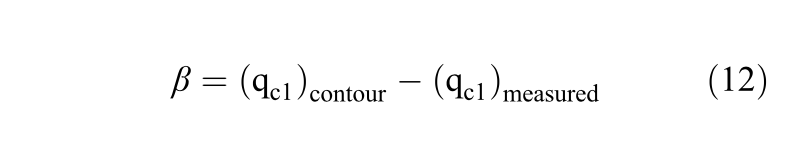
Therefore, β>0 will indicate that (qc1)contour >(qc1)measured for the same vertical effective stress, which indicates that the point in the profile is in a contractive state.
2.3 Shuttle & Cunning (2008)
Shuttle & Cunning (2007) presented a very detailed study using finite element analysis with cavity expan sion theory and the NorSand Model to evaluate the liquefaction potential of a very loose silt tailings (Rose Creek silt tailings). Following discussions with Peter K. Robertson, Shuttle & Cunning (2008) presented a contour to distinguish between contractive and dila tive behavior using the soil behavior chart suggested by Jefferies & Davies (1991), as presented in Figure 4.
Since the authors did not present the equation cor responding to the suggested contour, it is suggested herein the use of Equation 13 to be used to represent this boundary.

where,
To characterize the behavior of the soil with depth the parameter α will be used, defined by Equation 15. Following this definition, positive values of α will indicate that [Q(1-Bq)+1]Contour>[Q(1-Bq)+1]Measured, meaning that the measured value is located below the envelope shown in Figure 4 and, therefore, is susceptible to flow liquefaction.

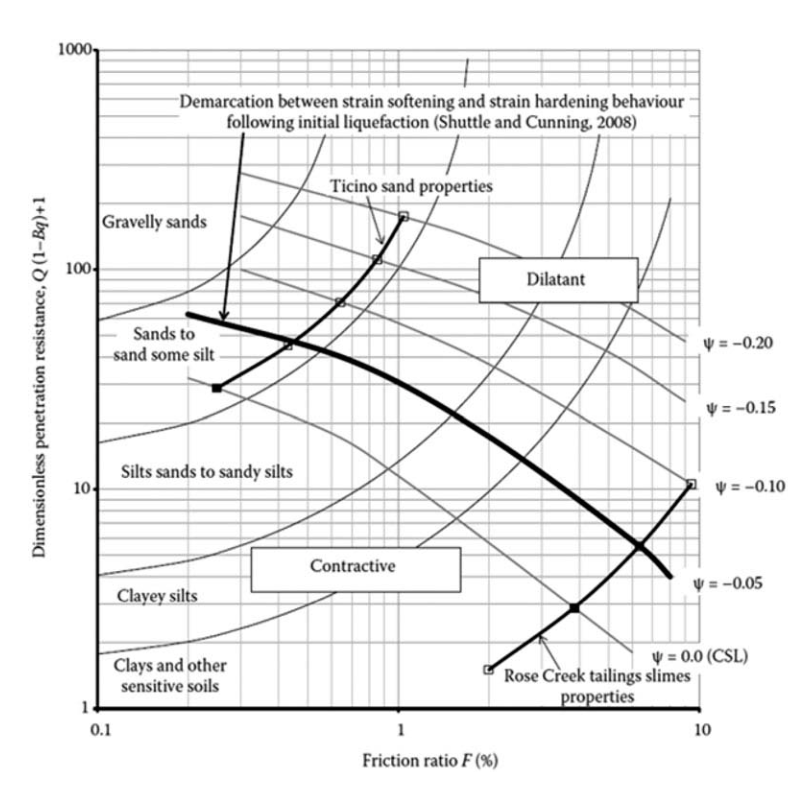
Figure 4. Boundary separating contractive from dilative behavior suggested by Shuttle & Cunning (2008) – Jefferies & Been (2016).
2.4 Robertson (2016)
Robertson (2016) updated the CPT-based normalized soil behavior type (SBTn) classification system pro posed by Robertson (2009) to use behavior-based instead of textural-based descriptions, as presented in Figure 5.
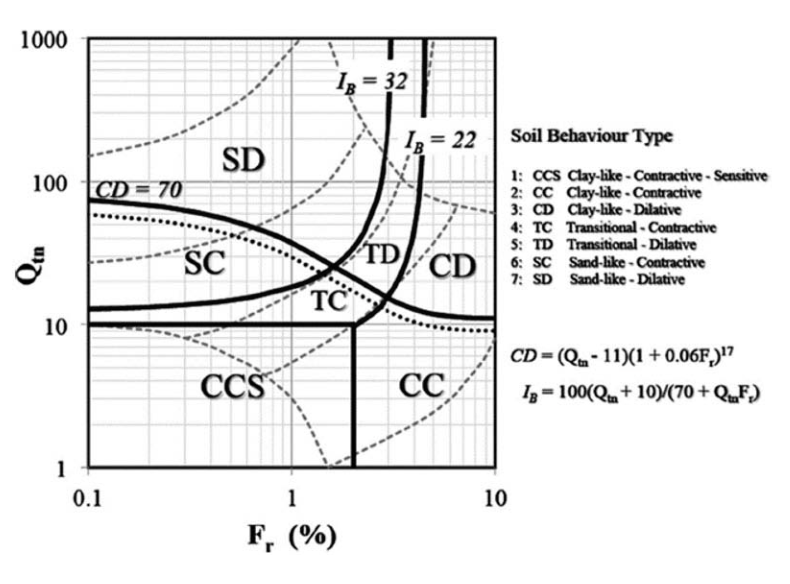
Figure 5. Updated CPT-based normalized soil behavior type chart proposed by Robertson (2016).
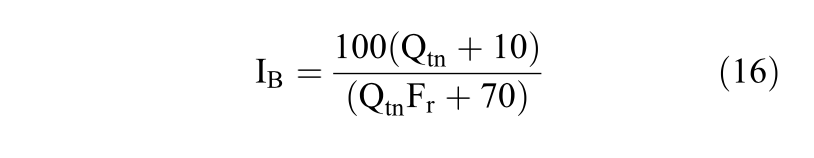
The author updated the soil behavior type index to use a hyperbolic shape, as indicated by Equation 16.
where,
 where n≤1.0.
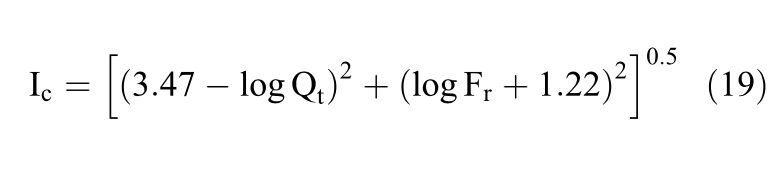
The soil behavior type index, Ic, was first proposed by Jefferies & Davies (1993) who recognized that the boundaries between the soil behavior type zones could be approximated by concentric circles whose radius indicates the soil behavior type index. Robertson & Wride (1998) modified the definition of Ic to apply to the Robertson (1990) chart, as defined by Equation 19.
Robertson (2016) suggested the use of the contour CD=70 (also shown in Figure 5) to differentiate soils that are contractive and dilative at large strains. The CD=70 boundary combines two different criteria: i) Qtn,cs=70 for sand-like soils and OCR=4 for transitional and clay-like soils. Equation 20 is suggested by the author to represent the contour CD=70.
3 RESULTS
The tailings evaluated herein is a by-product of the mining of iron ore in the state of Minas Gerais/ Brazil. The assessment of the tailings included the collection of disturbed samples to evaluate: i) the grain size distribution curve, ii) the water content (w), iii) the specific gravity of soil solids (Gs), iv) the unit weight (γ and γd), v) the liquid limit (LL) and vi) the plastic limit (PL).
The grain size distribution curves of the samples collected are shown in Figure 6. In terms of mean values, roughly 79% of the tailings corresponds to silt-sized particles, 4% to clay-sized particles and the remaining (17%) is fine sand. The fines were non- plastic and the mean values of the unit weight was γ=23.4 kN/m3 and γd=19.4 kN/m3.

Figure 6. Grain size distribution curves of the sandy-silt tailings according to the ASTM D422-63 (2007).
The collected samples were also used to deter mine the water content (w) and these values were converted to void ratio (e) using Equation 21. The mean value of water content was 21.4% and the void ratio was 0.93.

The specific gravity (Gs<.sub>) was determined following the procedures of the ASTM D854-14, to give a mean value of 3.8.
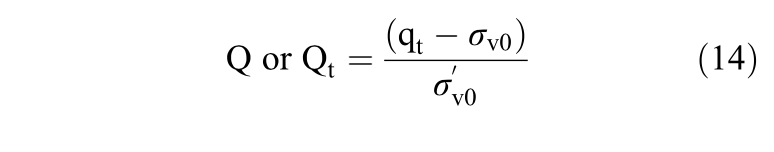
The normalized parameters (Qt, Fr and Bq) from the CPTu performed on the sandy-silt tailings is shown in Figure 7. As can be seen, the initial portion of the sounding did not show excess porewater pres sure up until 20m. Furthermore, below 27m the tail ings exhibit a very low tip resistance and high Bq values. It is also important to notice the high hetero geneity on the tailings profile due to the interbedded layers of clay-like and sand-like behavior.

Figure 7. Normalized CPTu parameters of the sounding performed in the sandy-silt tailings.
In order to evaluate the susceptibility of the tail ings to flow liquefaction the contours suggested by Robertson (2016), Shuttle & Cunning (2008) and Plewes et al. (1992) are presented in Figure 8. Based on the behavior observed in the sounding, the profile was divided into three main regions: i) Region I: Predominantly dilative behavior (0-16m), ii) Region II: Interbedded layers of contractive and dilative behavior (16-27m) and iii) Region III: Predomin antly contractive behavior (below 27m).

Figure 8. Evaluation of the susceptibility to flow liquefaction using a) Robertson (2016), b) Shuttle & Cunning (2008) and c) Plewes et al. (1992).
The results of the Fear & Robertson (1995) boundary suggested by Olson (2001) is shown in Figure 9. As can be observed, using this method most of the tailings profile is classified as contractive. In fact, only the first 2m of the profile (σ’v0<50kPa) was deemed to be in a dilative state.

Figure 9. Results of the susceptibility to flow liquefaction using the Fear & Robertson (1995) contour suggested by Olson (2001).
The limitations of the original contour suggested by Olson (2001) for medium and high compressibility soils was discussed herein in the section 2.2. Equa tion 12 was applied in this paper to account for the effect of compressibility and it was determined the ratio qc/N60 that would be necessary for the boundary suggested by Olson (2001) to yield results similar to the other methodologies evaluated. As can be seen in Figure 10, it was necessary to use a ratio of qc/N60 =0.07 (a reduction by a factor of 8.6 in relation to the original contour) to calibrate the Fear & Robertson (1995) boundary for use with the sandy-silt tailings.
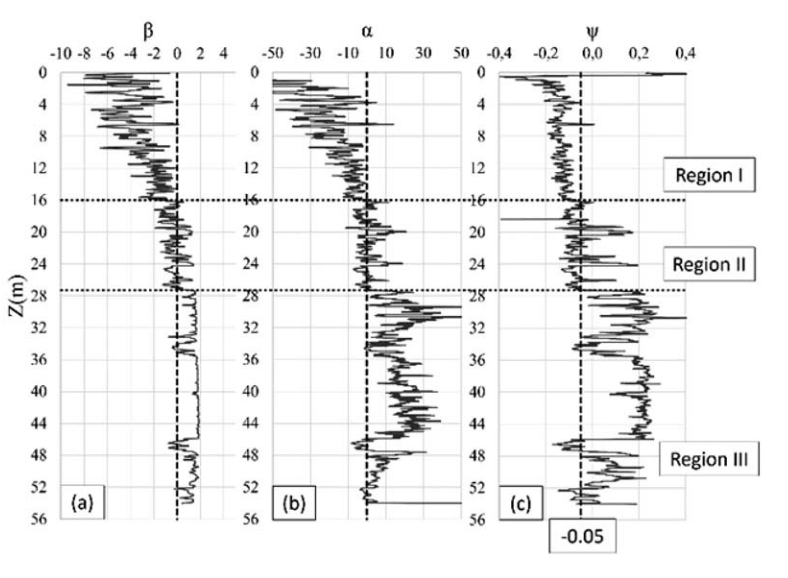
Figure 10. Evaluation of the susceptibility to flow liquefac tion using a) Olson (2001) corrected for qc/N60=0.07, b) Shuttle & Cunning (2008) and c) Plewes et al. (1992).
4 CONCLUSION
This paper presented an evaluation of the susceptibility to flow liquefaction of a sandy-silt tailings using four different methodologies: i) Plewes et al. (1992), ii) Olson (2001), iii) Shuttle & Cunning (2008) and iv) Robertson (2016).
The results of the study showed that for the tailings evaluated herein the contours suggested by Plewes et al. (1992), Shuttle & Cunning (2008) and Robertson (2016) yielded similar results (Figure 8).
The original boundary suggested by Olson (2001) resulted in a very conservative assessment (Figure 9). Equation 12 was used herein to account for the effect of compressibility and the ratio qc/N60=0.07 was used to correct the contour to yield results similar to the other methodologies evaluated.
The results of the study are useful to highlight the importance of the correction of the boundary suggested by Olson (2001) for soils of medium and high compressibility (specially tailings). Due to its inherent limitations, the authors do not recommend the use of the contour suggested by Olson (2001) to evaluate the susceptibility to flow liquefaction in soils of medium to high compressibility.
REFERENCES
ASTM D422-63(2007)e2. 2007. Standard Test Method for Particle-Size Analysis of Soils (Withdrawn 2016). ASTM International, West Conshohocken, PA.
ASTM D854-14. 2014. Standard Test Methods for Specific Gravity of Soil Solids by Water Pycnometer. ASTM International, West Conshohocken, PA.
Burland, J.B. & Burbidge, M.C. 1985. Settlement of Foun dations on Sand and Gravel. In Proceedings of the Insti tute of Civil Engineers (London). pp. 1325–1381.
Casagrande, A. 1975. Liquefaction and cyclic deformation of sands: A critical review. In Proceedings of the Fifth Panamerican Conference on Soil Mechanics and Foun dation Engineering. pp. 79–133.
Fear, C.E. & Robertson, P.K. 1995. Estimating the undrained strength of sand: a theoretical framework. Canadian Geotechnical Journal, 32(5): 859–870. doi:10.1139/t95-082.
Jefferies, M. G. & Been, K. 2016. Soil Liquefaction: A Critical State Apporach.
Jefferies, M.G. & Davies, M.P. 1991. Soil classification by the cone penetration test: Discussion. Canadian Geo- technical Journal, 28(1): 173–176. doi:10.1139/t91-023.
Jefferies, M.G. & Davies, M.P. 1993. Use of CPTu to Esti mate Equivalent SPT N60. Geotechnical Testing Jour nal, 16(4): 458–468. doi:10.1520/gtj10286j.
Kayen, R.E. Mitchell, J.K. Seed, R.B. Lodge, A. Nishio, S. & Coutinho, R. 1992. Evaluation of SPT, CPT and shear wave-based methods for liquefaction potential assess ment using Loma Prieta data. In Proceedings of the 4th Japan-U.S. Workshop on Earthquake Resistant Design of Lifeline Facilities and Countermeasures of Soil Liquefaction. pp. 177–192.
Olson, S.M. 2001. Liquefaction Analysis of Level and Sloping Ground Using Field Case Histories and Penetra tion Resistance.
Olson, S.M. 2009. Strength Ratio Approach for Liquefac tion Analysis of Tailings Dams. In Proceedings of the University of Minnesota 57th Annual Geotechnical Engineering Conference. pp. 37–46.
Plewes, H.D. Davies, M.P. & Jefferies, M.G. 1992. CPT based screening procedure for evaluating liquefaction susceptibility. In Proceedings of the 45th Canadian Geo- technical Conference.
Robertson, P.K. 1990. Soil classification using the cone penetration test. Canadian Geotechnical Journal, 27(1): 151–158. doi:10.1139/t90-014.
Robertson, P.K. 2009. Interpretation of cone penetration tests – A unified approach. Canadian Geotechnical Jour nal, 46(11): 1337–1355. doi:10.1139/T09-065.
Robertson, P.K. 2016. Cone penetration test (CPT)-based soil behaviour type (SBT) classification system — An
918
update. Canadian Geotechnical Journal, 53(12):
1910–1927. doi:10.1139/cgj-2016-0044.
Robertson, P.K. & Campanella, R.G. 1983. Interpretation
of Cone Penetration Tests. Canadian Geotechnical Jour
nal, 20(4): 718–745.
Robertson, P.K. & Wride, C.E. 1998. Evaluating cyclic
liquefaction potential using the cone penetration test. Canadian Geotechnical Journal, 35(3): 442–459. doi:10.1139/t99-102.
Schnaid, F. & Odebrecht, E. 2012. Ensaios de Campo e suas aplicações à Engenharia de Fundações.
Shuttle, D.A. & Cunning, J. 2007. Liquefaction potential of silts from CPTu. Canadian Geotechnical Journal, 44(1): 1–19. doi:10.1139/T06-086.
Shuttle, D.A. & Cunning, J. 2008. Reply to the discussion by Robertson on “Liquefaction potential of silts from CPTu.” Canadian Geotechnical Journal, 45(1): 142–145. doi:10.1139/T07-119.
Stark, T.D. & Olson, S.M. 1995. Liquefaction resistance using CPT and field case histories. Journal of Geotech nical Engineering, 121(12): 856–869. doi:10.1061/ (ASCE)0733-9410(1995)121:12(856).